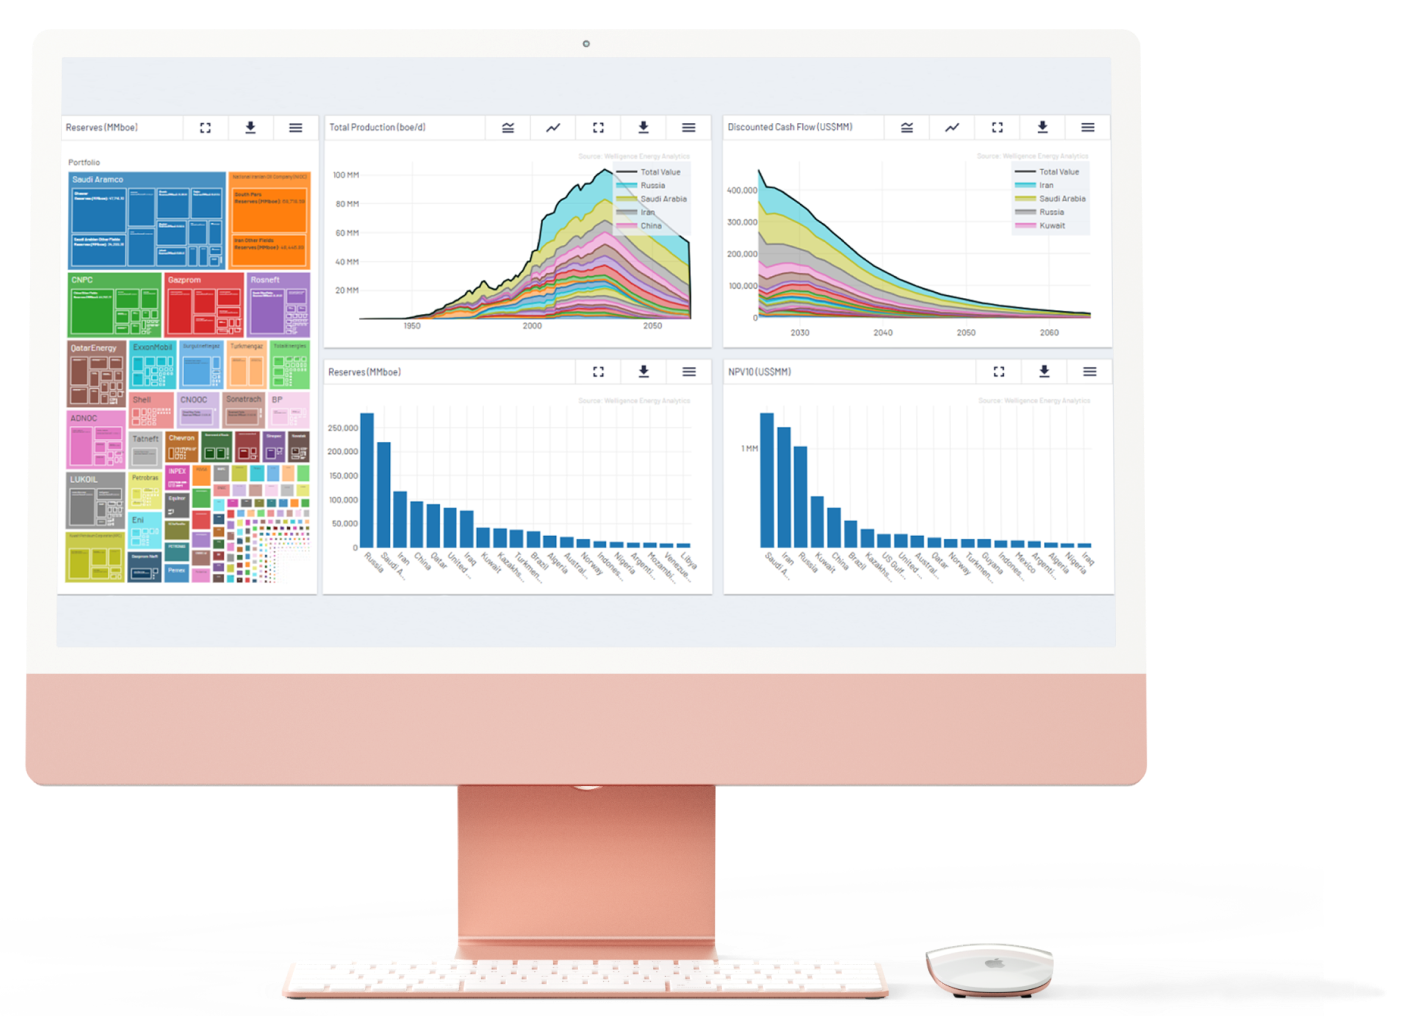
Global Upstream Portfolio Analysis Made Easy
Dive into the upstream portfolios of over 4,000 companies with assets across the globe. Complete with NPVs, production forecasts and histories, reserves, capex and opex forecasts, and more. Clients can build, visualize, benchmark, and model portfolios in seconds.
THE WELLIGENCE WAY
Welligence delivers real-time, data-driven portfolio analysis from the ground up
Our bottoms-up data and industry-leading update cycle ensure you always work with the most accurate, current view of the market. We combine machine-learning predictive models with on-the-ground research across the globe, giving you intelligence that is both timely and tested. Whether you’re evaluating assets, companies, or entire countries, Welligence equips you with the full context and tools to model every scenario with confidence.

Key Features & Benefits

Granular Asset-Level Insights
See the economics, production forecasts, and cost structures of roughly 3,500 assets.

Customizable Scenario Analysis
Model hypothetical scenarios and test strategies with adjustable inputs.

Benchmarking & Comparative Analysis
Compare portfolios across operators, regions, and assets with precision.

GHG & Emissions Tracking
Understand the emissions footprint of every portfolio and model reduction strategies.

Interactive Visualization Tools
Cut through complexity with intuitive dashboards and geographic data layers.

Real-Time Data Updates
Always work with the freshest data, continuously updated as we acquire new information.
“With Welligence, we don’t just manage our portfolio—we optimize it. The ability to run custom scenarios and benchmark against competitors is a game changer.”


Frequently Asked Questions
How detailed is the portfolio analysis?
Extremely detailed. We break down assets, cash flows, production timelines, and cost curves—by operator and country - so you can make fully informed decisions.
Can I model future scenarios?
Yes! Our platform lets you run hypothetical scenarios, adjusting key variables like production rates, commodity prices, and capex. You can test resilience across your portfolio and your competitors’ strategies.
How does the emissions analysis work?
We track Scope 1 & 2 emissions at the asset level, allowing you to view, model, and benchmark emissions data across your portfolio and compare against peer performance.